
Greyhound Injury Rates: Safety Statistics Across UK Tracks
Greyhound racing carries inherent risk. Dogs running at speeds exceeding 40 miles per hour, jostling for position around bends, will occasionally suffer injuries. The question for regulators, welfare advocates, and the betting public is not whether injuries occur—they do—but whether the industry manages and minimises them responsibly.
GBGB, the governing body for licensed greyhound racing in Britain, publishes annual injury data. These statistics have become central to debates about the sport’s future, cited by supporters as evidence of progress and by critics as proof of unacceptable risk. Understanding what the numbers actually show requires looking beyond headlines to examine methodology, trends, and context.
This guide presents current injury statistics for UK greyhound racing, traces how rates have changed over time, and examines the safety measures designed to protect dogs on the track. For anyone following racing at Oxford Stadium or considering where their betting money goes, these numbers provide essential context.
Current Injury Statistics
The 2026 data from GBGB shows an injury rate of 1.07% across all licensed tracks—meaning roughly one injury per hundred race starts. This figure represents the lowest rate since systematic recording began, continuing a downward trend observed over several years. For context, this translates to 3,809 recorded injuries across all GBGB-licensed venues during the year.
Injuries range in severity. Minor muscle strains may require only brief rest before a dog returns to racing. More serious injuries—fractures, ligament tears, catastrophic leg breaks—can end careers or prove fatal. GBGB categorises injuries by type and outcome, allowing analysis of whether improvements reflect fewer minor incidents, fewer serious ones, or both.
Trackside fatalities represent the most serious outcome. When a dog dies at the track—whether during a race, immediately after, or following emergency veterinary intervention—it enters a separate statistical category. These deaths receive particular scrutiny from welfare organisations, who argue that any trackside fatality is one too many.
The overall 1.07% rate aggregates data across 21 licensed tracks with varying configurations, surfaces, and racing programmes. Individual tracks may perform better or worse than this average. Oxford Stadium’s injury rate sits within normal ranges for venues of similar size and configuration, though GBGB does not publish detailed track-by-track breakdowns publicly.
Injury patterns also vary by race type. Sprint races over short distances involve different dynamics than marathon contests. Crowded fields produce more incidents than smaller fields. Analysing aggregate figures reveals industry trends; understanding specific contexts requires more granular data than GBGB typically releases.
How Rates Have Changed
Comparing current statistics to historical baselines reveals meaningful improvement. GBGB CEO Mark Bird summarised the trajectory: “There is much to be pleased and encouraged by in this year’s data. It shows that the initiatives we have introduced in recent years are now embedded and are helping to consolidate the significant progress we have made since 2018 across all measures.”
The 2018 baseline is significant because it preceded several major welfare initiatives. Injury rates, fatality rates, and retirement outcomes have all improved since that year. Whether this reflects genuine safety improvements or methodological changes in data collection is debated, but the directional trend appears consistent across multiple measures.
Fatality rates have also declined. The trackside death rate dropped from 0.06% in 2020 to 0.03% in 2026—a halving over four years. This improvement suggests that both injury prevention and emergency veterinary response have strengthened, though critics note that any percentage translates to real dogs dying.
Long-term historical data is harder to assess because systematic injury recording at today’s granularity did not exist decades ago. Anecdotal evidence suggests injury rates were substantially higher in earlier eras when track surfaces, veterinary care, and regulatory oversight were less developed. Modern racing operates under conditions that would have seemed impossibly cautious to mid-century trainers.
What Tracks Do to Prevent Injuries
Track surface maintenance represents the primary safety intervention. GBGB works with the Sports Turf Research Institute (STRI) to establish standards for sand depth, compaction, and moisture content. Tracks that fail to maintain proper surfaces face regulatory action. At Oxford, surface conditions are monitored regularly and adjusted based on weather and usage patterns.
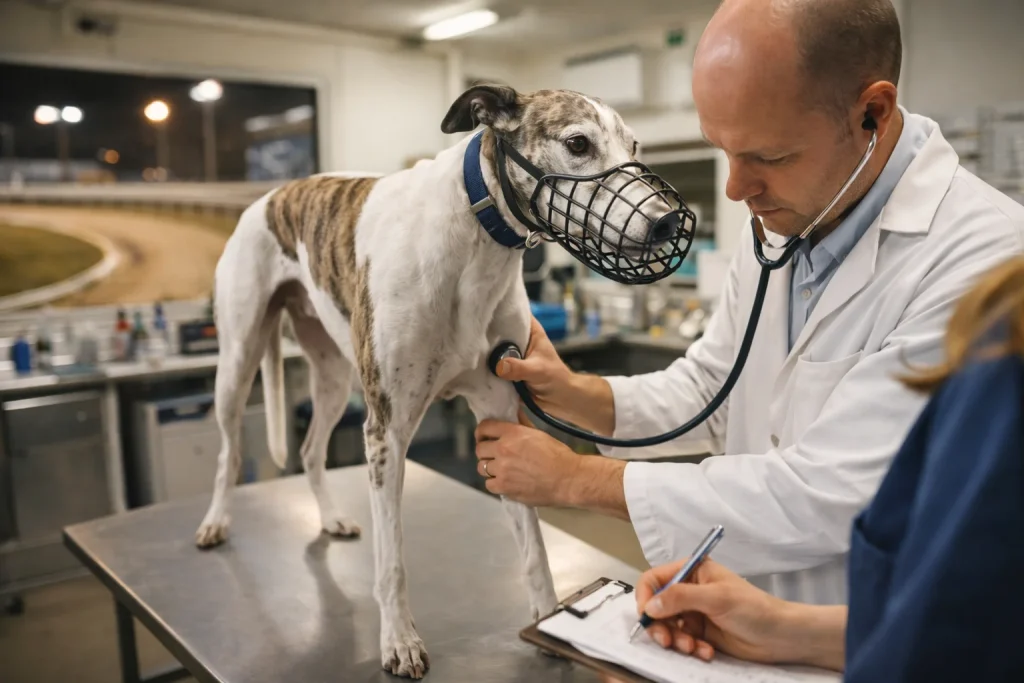
Veterinary presence is mandatory at all licensed meetings. Dogs receive pre-race inspections, and veterinary staff remain on-site throughout racing to provide immediate care if injuries occur. This contrasts with unlicensed “flapping” tracks, where veterinary coverage may be inconsistent or absent.
Grading systems aim to match dogs of similar ability, reducing the speed differentials and crowding that contribute to accidents. When a faster dog overtakes a slower one at high speed around a bend, collision risk increases. Proper grading minimises these mismatches, though it cannot eliminate them entirely.
The Injury Recovery Scheme (IRS) provides financial support for treatment of injured greyhounds. Since its introduction in December 2018, nearly £1.5 million has been paid through the scheme, covering veterinary costs that might otherwise discourage owners from pursuing treatment. This funding mechanism removes some financial pressure to euthanise treatable injuries.
Racing rules also incorporate safety provisions. Stewarding at race meetings monitors for interference, dangerous running, and rule violations that could cause harm. Dogs that consistently cause trouble may face exclusion. These behavioural controls complement physical safety measures to create a multilayered approach to injury prevention.
The Ongoing Argument
Industry representatives point to declining injury rates as evidence that greyhound racing can be conducted responsibly. The combination of track maintenance, veterinary oversight, grading systems, and financial support for injured dogs represents a comprehensive approach to welfare that did not exist in previous generations.
Critics counter that any injury rate above zero is unacceptable for a sport conducted purely for human entertainment and gambling. They note that absolute numbers—3,809 injuries in 2026—represent thousands of dogs experiencing pain. The distinction between acceptable and unacceptable injury rates is ultimately a value judgment that statistics alone cannot resolve.
For bettors, injury statistics provide context for understanding the sport they wager on. Racing involves real animals taking real risks, and the industry’s willingness to publish data—warts and all—at least allows informed assessment of those risks.
Numbers and Responsibility
UK greyhound racing’s injury transparency distinguishes it from many other animal sports. The annual publication of detailed statistics—injury rates, fatality rates, retirement outcomes—subjects the industry to scrutiny that supporters argue demonstrates accountability and critics use as ammunition.
What the data clearly shows is improvement. Whether that improvement satisfies expectations depends on where those expectations start. For those who believe greyhound racing should continue, declining injury rates suggest a sport becoming safer. For those who believe it should end, any injury is evidence of fundamental cruelty. Oxford Stadium and its sister tracks operate within this contested space, trying to minimise harm while pursuing a sport that carries irreducible risk.
The 1.07% injury rate and 3,809 total injuries in 2026 are not abstract statistics. They represent real dogs, real incidents, and real consequences. How you interpret those numbers depends on your framework for thinking about animal welfare, human entertainment, and the responsibilities that link them. The data provides facts; values determine conclusions.