
How to Read Oxford Greyhound Racecards: A Complete Beginner’s Guide
Learning how to read an Oxford greyhound racecard is the difference between informed betting and throwing darts blindfolded. Every race at Oxford Stadium publishes a racecard stuffed with data—trap positions, form lines, calculated times, trainer records—and most punters glance at it for three seconds before backing the dog with the clever name. That approach loses money consistently.
A racecard is not decoration. It is a compressed biography of each runner, distilled into symbols and numbers that reveal patterns invisible to casual observers. The form line tells you whether a dog finishes strongly or fades after the first bend. The calculated time adjusts for track conditions, letting you compare performances across different meetings. The trap number suggests where traffic problems might develop. None of this requires a degree in statistics. It requires knowing what to look for and why it matters.
This guide breaks down every element you will encounter on an Oxford racecard. By the end, you will be able to pick up any card from Oxford Stadium and extract meaningful information within minutes. That skill compounds over time. The punters who consistently make money are not lucky—they read racecards better than everyone else in the queue.
Anatomy of a Racecard
An Oxford racecard follows the same basic structure as cards from other GBGB-licensed tracks, but understanding that structure transforms a wall of text into actionable intelligence. The header section tells you what kind of race you are watching. It includes the race number (typically 1 through 12 on a full card), the scheduled start time, the distance in metres, and the grade. These four pieces of information shape everything that follows.
Distance matters enormously because different dogs excel at different distances. Oxford Stadium runs six distances: 250, 450, 595, 645, 845, and 1045 metres. A sprinter dominant over 250 metres might struggle to maintain pace over 595 metres. The grade—ranging from A1 down to A11, plus open and maiden races—indicates the quality of the field. An A1 race features the track’s best performers. An A10 race features dogs still finding their level. Comparing form across grades without adjustment leads to poor decisions.
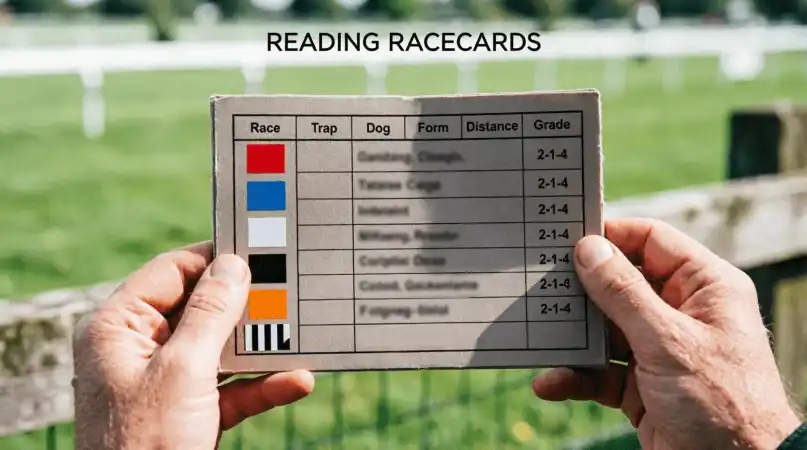
Below the header, each dog occupies a row. The entry line packs considerable information into limited space: trap number and colour, the dog’s name, the trainer, recent form figures, weight, best times at this distance, calculated time, and sometimes ratings from services like Timeform. Some racecards include sectional times—splits showing how fast the dog covered different portions of the race. Others include race comments summarising the dog’s most recent run. Every piece serves a purpose, and skipping any of it means missing part of the picture.
The visual layout prioritises quick scanning. Trap numbers appear at the far left, colour-coded for immediate recognition. Names follow, then trainer initials. The form line—a string of digits and letters—sits near the centre, usually the most information-dense element on the row. Times and ratings occupy the right side, offering numerical benchmarks for comparison. Once you internalise this layout, parsing a full card takes under a minute.
Trap Numbers and Colours
Every greyhound race in Britain uses a standardised trap colour system. Trap 1 wears red. Trap 2 wears blue. Trap 3 wears white. Trap 4 wears black. Trap 5 wears orange. Trap 6 wears black and white stripes. This colour coding exists because greyhounds cannot read numbers, and identifying dogs during a race—especially around tight bends—requires instant visual recognition. You will see these colours on the racing jacket each dog wears, matching the trap number on the racecard.
Trap position influences race outcomes more than casual observers expect. The inside traps (1 and 2) sit closest to the rail, offering a shorter path around bends but greater risk of crowding. The outside traps (5 and 6) face a longer route but often enjoy clearer running if the inside dogs tangle. Middle traps (3 and 4) balance these factors. Track-specific data reveals significant biases. According to analysis from The Game Hunter, Trap 1 shows a win percentage around 18-19% across most tracks—noticeably above the 16.6% that pure probability would suggest for six runners.
Oxford Stadium exhibits its own trap characteristics. Oxford Stadium’s own analysis indicates that Trap 3 holds a statistical edge of approximately 2% over its nearest competitor. This advantage compounds over many races. A punter who consistently overlooks trap position surrenders that edge to those who account for it. The racecard shows you the trap number prominently; the smart play is using that information rather than ignoring it.
Running style interacts with trap position. A fast-breaking dog drawn in Trap 1 can seize the rail and control the race. A wide runner drawn in Trap 6 may swing even wider, covering extra ground. Some racecards include comments noting whether a dog prefers rails or runs wide. Cross-referencing that preference with the trap draw reveals whether the dog has drawn favourably. A rails runner in Trap 6 faces an uphill battle. A wide runner in Trap 1 might cause chaos into the first bend.
Form Line Decoded
The form line is the racecard’s densest information source. It appears as a string of characters—typically six—representing the dog’s most recent races. The leftmost character shows the most recent result. Reading left to right means reading backwards in time. A form line of 321421 shows a dog that finished third last time out, second before that, first before that, and so on. This sequence reveals trajectory: is the dog improving, declining, or holding steady?
Digits 1 through 6 indicate finishing positions. A string of 1s suggests consistent winning form—valuable but also likely reflected in shorter odds. A dog showing 654321 presents an ascending trajectory, potentially catching better opposition off guard. The pattern matters as much as the individual numbers. Three consecutive 1s followed by a 4 might indicate a dog returning from rest or stepping up in grade. Context shapes interpretation.
Letters interrupt the digit sequences to flag non-standard outcomes. F means fell. This could indicate a collision, a stumble, or trapping issues. One fall might be bad luck; multiple Fs suggest a problem that could recur. W indicates the dog ran wide, often adding significant distance to its race. S means the dog was slowed, typically by interference from other runners. B indicates the dog was baulked—blocked by another dog and unable to run its race. Each letter tells a story that simple finishing positions cannot.
Less common codes appear occasionally. O means the dog ran on—finished strongly, perhaps after a slow start. This signals a dog that could improve with a better break. K indicates the dog was checked—had to adjust stride mid-race due to close proximity with another runner. Some racecards abbreviate these differently, but the core principle remains: letters represent incidents, and incidents explain unexpected results. A dog with form reading 2F4321 did not suddenly become a poor runner; something happened in that fall race that skewed the outcome.
Recency weighting matters. A dog’s most recent form carries more predictive power than older results. Greyhound form can shift quickly—fitness changes, minor injuries heal or develop, confidence builds or erodes. A form line showing 111654 looks unimpressive overall, but those last three races might have occurred months ago, before a layoff and retraining. Checking the dates of recent races, when available, adds another layer of insight.
Comparing form lines across the field reveals relative strength. If five dogs show scattered form and one shows 211111, that consistency demands respect. But if the consistent dog raced in A7 grade and now faces A4 opposition, the form line needs contextual adjustment. The numbers alone cannot account for the quality of opposition faced. Experienced racecard readers develop intuition for when form translates across grades and when it misleads.
Weights and Grades
Every racecard lists each dog’s racing weight, measured in kilograms. Most greyhounds weigh between 28 and 36 kilograms, though individual dogs maintain consistent weights once they reach racing maturity. The weight figure itself tells you less than weight changes over time. A dog carrying 31.5 kilograms consistently presents different considerations than one fluctuating between 30 and 33 kilograms across recent races. Sudden weight drops may signal illness or excessive training; sudden gains might indicate reduced fitness or changes in diet.
Weight interacts with distance preferences. Heavier dogs often perform better over longer distances where raw stamina matters more than initial acceleration. Lighter dogs may show sharper early pace, crucial over sprint distances like 250 metres. Oxford’s range of distances—from 250 metres to 1045 metres—means weight becomes increasingly relevant as races lengthen. A 35-kilogram stayer built for the 845-metre trip might struggle to match lighter, quicker types over 250 metres.
The grade system structures competition at Oxford and all other GBGB-licensed tracks. According to the GBGB Rules of Racing, grades run from A1 (the highest standard at a given track) through A11 (the lowest). Open races stand apart from graded competition, attracting dogs based on specific criteria rather than grade bands. Maiden races feature dogs that have not yet won a race at the track. The system ensures roughly even competition within each grade, though in practice the gap between top and bottom of a grade band can be significant.
Grade movements tell a story. A dog promoted from A5 to A3 after several wins faces a step up in opposition. The racecard may show strong form, but that form came against weaker competition. Conversely, a dog dropping from A2 to A4 brings higher-level experience to a grade where opposition may underestimate it. Tracking which dogs are rising versus falling through the grades adds predictive value that raw form lines cannot capture. The racecard shows the current grade; historical grade movements often require consulting past results.
Calculated Time and Sectionals
Raw race times vary with track conditions. A dog clocking 28.50 seconds over 450 metres on a fast surface might run 28.90 seconds on a slower surface and remain equally capable. This variability would make historical comparisons meaningless—except that calculated times solve the problem. The calculated time adjusts each performance to a standardised track condition, typically expressed as the time the dog would have run on a “going allowance” of zero. This standardisation enables fair comparison across meetings held weeks or months apart.
Racecards display calculated times alongside or in place of raw times precisely because calculated times offer superior predictive value. A dog with a best calculated time of 28.30 at Oxford over 450 metres has demonstrated a level of ability that another dog with a 28.80 calculated time has not matched, regardless of what the raw stopwatch showed. When evaluating a field, rank dogs by calculated time rather than by single-race clockings.
Sectional times break each race into segments, revealing how a dog distributes effort. The most important sectional is the time to the first bend, often called the “run-up” or “early pace” split. A dog reaching the first bend ahead of rivals controls position for the remainder of the race. According to Timeform’s analysis, the dog leading at the first bend wins approximately 35% of races—a massive edge in a six-runner field. This single statistic explains why trap position and early speed dominate serious handicapping.
Middle sectionals show how a dog handles the bends. Tight tracks—and Oxford’s 379-metre circumference qualifies as tighter than many—punish dogs that swing wide. Bend times can expose this inefficiency even when overall times look competitive. If a dog loses two tenths of a second on each bend due to wide running, it surrenders ground that translates directly into lost positions. The racecard may not always display full sectionals, but when available, they reward careful study.
“Ratings and sectionals help highlight greyhounds that have run to a high level but, crucially, been denied a clear run,” as Timeform’s beginner’s guide explains. A dog with strong sectional components but a disappointing finish position may have encountered traffic; its calculated time alone would understate its ability. Sectionals expose these situations, revealing quality that headline figures obscure.
Run-in times—the final sectional from the last bend to the finish line—indicate closing speed. Some dogs accelerate through the finish; others tire. A strong run-in time alongside weak earlier sectionals describes a dog that starts slowly but finishes powerfully. That profile suits wide draws and longer distances where early crowding becomes less decisive. Conversely, weak run-in times from a dog showing strong early splits suggest a pace bias—it must lead early or risk being caught late.
Trainer and Kennel Info
Every dog on the racecard is attributed to a trainer, usually shown as an abbreviated name or initials. Trainers matter because they influence factors the racecard cannot fully capture: conditioning methods, race selection, recovery protocols, and the overall care that shapes a greyhound’s readiness. Some trainers produce consistent results; others show volatile patterns. Over time, familiarity with trainers competing regularly at Oxford reveals tendencies worth noting.
Strike rate—the percentage of runners that win—offers one measure of trainer performance. A trainer with a 20% strike rate consistently places capable dogs in appropriate races. A trainer with a 10% strike rate might be overmatching runners, experimenting with young dogs, or recovering from a difficult period. The racecard does not display trainer statistics directly, but resources like Timeform and Racing Post publish them. Cross-referencing trainer form before examining individual dogs saves time spent on entries whose trainers are struggling.
Kennel form describes whether a trainer’s overall string is performing well. A top trainer in poor kennel form might send out multiple disappointing runners over a period of weeks, suggesting systemic issues—illness circulating through kennels, training problems, or simply a patch of bad luck. Conversely, a middling trainer enjoying strong kennel form brings confidence that extends to all their entries. These patterns emerge from watching results over time rather than from any single racecard.
Some trainers specialise. One might excel at preparing young dogs for maiden races. Another might focus on sprinters, consistently producing quick breakers over 250 metres. Recognising these specialities helps contextualise racecard information. A trainer whose dogs routinely show strong run-in times has developed a conditioning approach favouring late pace. That pattern affects how you interpret early pace sectionals from their runners: weaknesses in early pace may reflect training priorities rather than limitations.
Comments and Ratings
Race comments summarise what happened during a dog’s most recent run. These short notes appear on some racecards, particularly from premium data providers. Common abbreviations include LED (led the field), RAN ON (finished strongly from the back), CHLGD (challenged the leader), BMP (bumped by another dog), and SAW OUT (lasted well to the line). Each abbreviation sketches a narrative that numbers alone cannot convey. A finishing position of 3rd means little without knowing whether the dog led early and faded, or closed from last to reach third.
Comments help explain anomalies in form lines. A dog showing a 5th-place finish might have been BAULKED at the first bend, losing any chance while still carrying enough ability to beat the field otherwise. A LED comment followed by a 2nd-place finish suggests a dog that controlled the race until caught late—still a strong performance obscured by the finishing position. Reading comments transforms finishing positions from raw results into understood narratives.
Ratings quantify ability on a numerical scale. Timeform ratings, widely used in greyhound racing, range from around 0 to 140, with higher numbers indicating superior performers. An A1-graded dog might carry a rating of 100 or above; an A8-graded dog might sit in the low 80s. Ratings aggregate multiple performances, smoothing out single-race variance. They also allow comparison across tracks, since ratings adjust for track-specific conditions. When a racecard includes Timeform or similar ratings, they provide a starting point for ranking the field.
Ratings change over time. A dog with a rating that has risen steadily over recent months shows improvement that raw form might understate. A dog with a declining rating might be losing form or ageing out of peak performance. The racecard typically shows a single current rating, but tracking historical ratings—available through rating services—reveals trajectory. A rating of 90 from a dog previously rated 85 implies different potential than a 90 from a dog previously rated 98.
Comments and ratings complement each other. The rating provides a numerical benchmark for expected ability; the comments explain why recent performances aligned or diverged from that benchmark. A high-rated dog with a comment reading BAULKED 1st suggests ability constrained by bad luck—a situation that might not recur. A low-rated dog with LED comments consistently might be overperforming against weak opposition, liable to struggle when stepped up in class. Synthesising both streams produces a richer assessment than either alone.
Putting It All Together
Reading a racecard efficiently requires a repeatable sequence. Start with the race header: note the distance and grade. A 450-metre A4 race sets specific expectations. The dogs competing should have ability appropriate to A4 level, and distance preferences should favour standard-distance runners. Any dog with form exclusively at 250 metres faces a question mark extending to 450 metres.
Scan the trap draw. At Oxford, remember that Trap 3 has demonstrated a measurable edge, that Trap 1 outperforms statistical expectation, and that wide runners in inside traps often cause first-bend trouble. Note which dogs might face positional challenges based on their preferred running style and their draw. A rails runner in Trap 5 needs fast enough early pace to cross over, and the form line should confirm whether that pace exists.
Examine form lines left to right, weighting recent performances heavily. Look for consistency, improvement, or regression. Check for letter codes indicating interference. A dog showing 111F21 won three before falling, then recovered to win again—that fall was an incident, not a pattern. A dog showing FFF111 had problems that now appear resolved. Context determines interpretation.
Compare calculated times. The dog with the fastest calculated time over the relevant distance holds a proven edge, assuming conditions hold. But consider whether that time came at Oxford or elsewhere. Track translation is imperfect; a time set at a galloping track may not transfer to Oxford’s tighter bends. Prioritise times recorded at Oxford when available.
Factor in weights and grade movements. A dog stepping down in grade after struggling at a higher level might bounce back. A dog stepping up after dominating lower grades faces a test. Weight stability suggests consistent conditioning; weight fluctuation merits caution. Neither factor overrides form and times, but both refine estimates at the margins.
If sectionals are available, check early pace and run-in times. A dog with strong early pace drawn in Trap 1 or 2 can seize the rail and control position. A closer drawn wide will have to navigate traffic before unwinding a finishing kick. Match running style to trap draw to distance to grade, and a picture emerges—not certainty, but informed probability that beats guessing.
Finally, note the trainer and check comments or ratings if provided. The favourite in a race, according to OLBG analysis, wins approximately 35.67% of graded races across British tracks—better than random chance but far from guaranteed. Racecards equip you to determine when the favourite deserves support and when another dog offers value. The goal is not to predict every winner; the goal is to make bets where your assessment exceeds the implied probability of the odds.
Conclusion
Every Oxford racecard contains the information needed to make informed selections. Trap numbers, form lines, weights, grades, calculated times, sectionals, trainer records, comments, and ratings—these elements interlock. Mastering them takes practice, but the process follows consistent logic. Start with structure, layer in numbers, contextualise with narrative, and synthesise toward a decision. The punters who treat racecards as decoration leave value on the table for those willing to read.
The real edge comes from repetition. Read cards before every meeting, even meetings you do not attend. Compare predictions against outcomes. Note where the racecard signalled correctly and where it misled. Over weeks and months, patterns sharpen. A form line that once looked opaque becomes instantly readable. A trap draw that once seemed irrelevant becomes a reflex to check. That progression turns racecard reading from effort into instinct—and instinct into consistent results.